
The Dust You Can See Is Not the Whole Story
A dusty construction site, a busy road, or a manufacturing workshop may look like an obvious source of air pollution. But here is something worth considering: the particles you can see are not necessarily the most concerning ones.
Some airborne particles are so small that they remain invisible to the naked eye. They can stay suspended in the air, travel with wind currents, and enter the respiratory system when inhaled.
This is where PM2.5 and PM10 come in. These two indicators are widely used in air quality monitoring, but what do they actually measure? And why should industrial facilities, construction projects, and environmental monitoring teams pay attention to both?
1. What Are PM2.5 and PM10?
PM stands for particulate matter — a mixture of tiny solid particles and liquid droplets suspended in the air. These particles can come from natural sources as well as human activities.
The numbers 2.5 and 10 refer to the particles’ aerodynamic diameter, measured in micrometers (µm).
- PM2.5: Fine particles with an aerodynamic diameter of 2.5 µm or smaller.
- PM10: Inhalable particles with an aerodynamic diameter of 10 µm or smaller.
To put their size into perspective, a human hair is typically around 50–70 µm in diameter. PM2.5 particles are much smaller, making them difficult to see without specialized instruments.
2. PM2.5 vs. PM10: What’s the Key Difference?
The main difference is particle size, but that difference also affects where particles can travel and how they interact with the human respiratory system.
| Comparison | PM2.5 | PM10 |
| Particle size | ≤ 2.5 µm | ≤ 10 µm |
| Common sources | Combustion, vehicle exhaust, industrial emissions, secondary atmospheric particles | Road dust, construction activities, soil, material handling, industrial processes |
| Airborne behavior | Can remain suspended in the air for extended periods | Larger particles generally settle faster, depending on conditions |
| Respiratory impact | Can penetrate deep into the lungs | Can enter the respiratory tract, with many particles depositing in the upper airways |
An important detail: PM10 includes PM2.5. In other words, PM10 represents a broader size category, while PM2.5 focuses on the finer fraction.
3. Why Does Particle Size Matter?
Particle size influences how deeply airborne particles can enter the respiratory system.
Larger particles are more likely to be trapped in the nose and upper respiratory tract. Fine particles such as PM2.5 can travel deeper into the lungs, and some components may contribute to cardiovascular and respiratory health risks.
This is why PM2.5 receives particular attention in air quality research and public health monitoring.
However, PM10 should not be overlooked. Coarse particles generated by construction, mining, road dust, and material handling can also affect air quality and respiratory health.
The key point: smaller does not mean the only important one. Both particle fractions provide valuable information about airborne pollution.
4. Where Do PM2.5 and PM10 Come From?
Understanding the sources of particulate matter helps determine what should be monitored and where measurements should be taken.
PM2.5 is commonly associated with:
- Vehicle exhaust and fuel combustion
- Industrial combustion processes
- Power generation
- Smoke and atmospheric chemical reactions
PM10 is commonly associated with:
- Construction and demolition activities
- Mining, crushing, and material handling
- Unpaved roads and road dust
- Soil disturbance and industrial material processing
Many activities produce both PM2.5 and PM10. For example, a construction site may generate coarse dust from excavation and fine particles from diesel-powered machinery.
That is why monitoring only one particle size may provide an incomplete picture of site conditions.
5. Why Should Industrial and Outdoor Projects Monitor Both?
For industrial facilities and outdoor projects, particulate matter monitoring is not simply about collecting numbers. It helps teams understand pollution patterns, identify potential emission sources, and evaluate environmental conditions over time.
Monitoring both PM2.5 and PM10 can support several practical tasks:
- Construction sites: Track dust generated by excavation, demolition, and material transportation.
- Manufacturing facilities: Observe particulate emissions from production processes and material handling.
- Mining operations: Monitor airborne dust around crushing, screening, and transportation areas.
- Environmental assessment: Collect data to support site evaluations and environmental management.
- Long-term outdoor monitoring: Observe changes in particulate concentrations under different weather and operating conditions.
Continuous or regular monitoring can also help identify changes that occasional spot measurements may miss.
6. How Can an Air Quality Monitoring System Help?
Reliable particulate matter data starts with appropriate monitoring equipment.
An outdoor air quality monitoring system can measure PM2.5 and PM10 alongside other environmental parameters, depending on its configuration. With continuous data collection and remote monitoring capabilities, users can observe changing conditions without relying entirely on manual inspections.
For projects that require long-term outdoor monitoring, equipment selection should consider:
- Measurement requirements: Confirm that the system supports the particulate matter parameters required by the project.
- Environmental adaptability: Consider temperature, humidity, rain, dust, and other site conditions.
- Data access: Remote data transmission can make it easier to review monitoring results from different locations.
- Power supply: Solar power or other suitable power options may support monitoring in areas without convenient access to electricity.
- Customization: Different projects may require different sensors, sampling methods, communication options, or installation solutions.
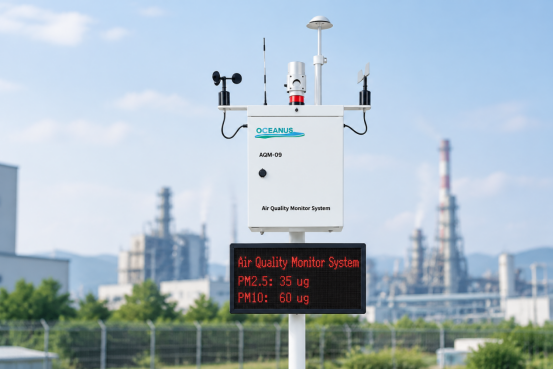
For example, the Oceanus AQM-09 Air Quality Monitoring System can be configured for project-specific environmental monitoring requirements, helping users collect particulate matter and other environmental data in outdoor applications.
7. Better Air Quality Management Starts with Better Data
PM2.5 and PM10 may look like two similar numbers on a monitoring screen, but they describe different particle-size fractions and provide complementary information about airborne pollution.
PM2.5 helps reveal the presence of fine particles that can penetrate deep into the lungs, while PM10 provides a broader view that also includes larger inhalable particles.
For factories, construction sites, mining operations, and outdoor environmental projects, monitoring both indicators can provide a more complete understanding of air quality.
Because effective air quality management starts with knowing what is in the air — not just what we can see.
Explore Oceanus air quality monitoring solutions for different environmental monitoring applications.
Whatsapp: +86 15981942832
Email: info@china-oceanus.com